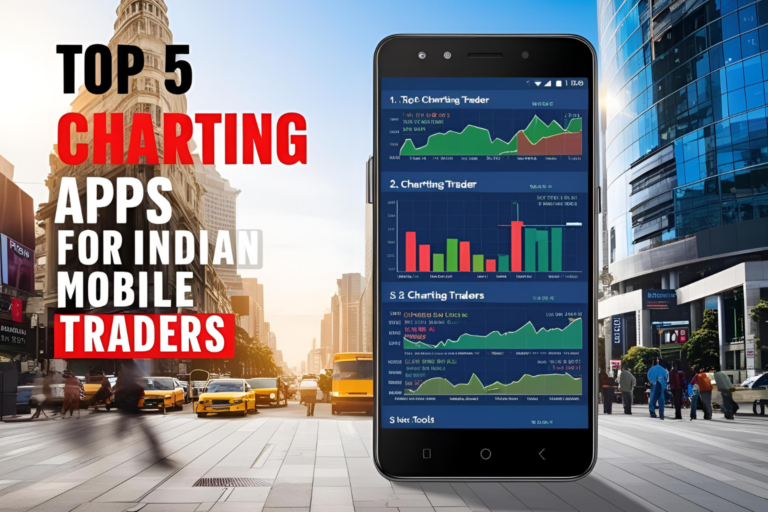
Top 5 Charting Apps for Indian Mobile Traders
In today’s fast-paced stock market, having access to real-time stock charts on your mobile device is essential. Whether you’re an intraday trader or a swing trader, charting apps allow you to track patterns, monitor indicators, and stay ahead—even when you’re away from your desktop. Here’s a list of the top 5 charting apps for Indian…