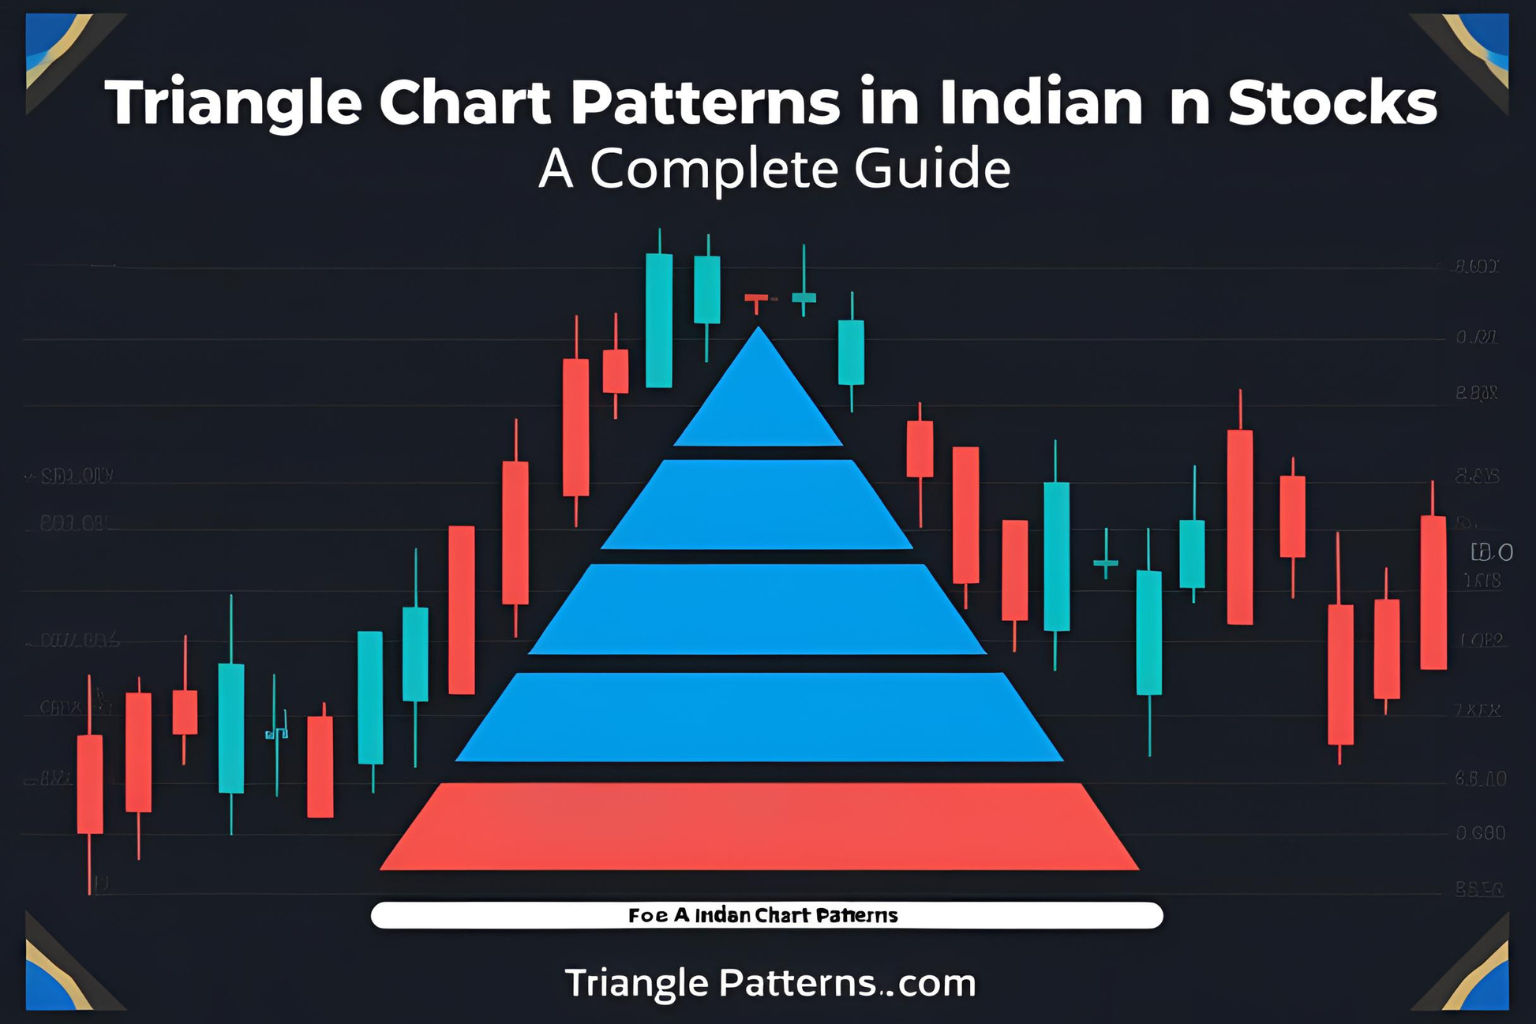
Triangle Chart Patterns in Indian Stocks: A Complete Guide
Triangle chart patterns are powerful tools in technical analysis. Commonly observed in Indian stocks like Reliance, HDFC Bank, and NIFTY 50, triangle formations help traders anticipate breakouts and trend continuation. This guide explains the types of triangle patterns, how to identify them on Indian stock charts, and strategies for trading them effectively.
What Is a Triangle Chart Pattern?
A triangle chart pattern is a consolidation pattern formed when price moves between converging trendlines. It shows a period of indecision between buyers and sellers before a breakout.
Types of Triangle Patterns
1. Ascending Triangle
- Structure: Horizontal resistance with rising support
- Bias: Bullish
- Signal: Breakout above resistance
Example: Seen in Infosys before strong bullish moves.
2. Descending Triangle
- Structure: Horizontal support with falling resistance
- Bias: Bearish
- Signal: Breakdown below support
Example: Found in Tata Motors during distribution phases.
3. Symmetrical Triangle
- Structure: Converging trendlines with lower highs and higher lows
- Bias: Neutral until breakout
- Signal: Watch for breakout direction (bullish or bearish)
Common in BANKNIFTY during pre-budget consolidation.
How to Identify Triangle Patterns on Indian Charts
- Open daily or 1-hour charts on platforms like TradingView India or Zerodha Kite
- Mark 2+ touchpoints on both the upper and lower trendlines
- Observe the price squeezing into the apex
- Confirm breakout with volume spike
Trading Triangle Patterns: Entry & Exit
| Action | Rule |
|---|---|
| Entry | Enter on candle close outside the triangle boundary |
| Stop-Loss | Below last swing low (for bullish) or high (bearish) |
| Target | Measure triangle height and project from breakout |
Example: Ascending Triangle in HDFC Bank
- Resistance: ₹1,600
- Support: Higher lows from ₹1,500
- Breakout Point: ₹1,610 with volume
- Target: ₹1,700+ (based on height projection)
Tips for Indian Traders
- Use daily charts for positional trades and 15-min/1-hr charts for intraday
- Wait for volume confirmation before entering
- Be cautious of false breakouts during news events or low volume periods
- Combine with indicators like RSI or MACD for confirmation
FAQs
1. Are triangle patterns reliable in the Indian market?
Yes, triangle patterns are frequently seen in NSE/BSE stocks and work well when volume supports the breakout.
2. Which triangle pattern is most bullish?
Ascending triangle is considered the most bullish of the three.
3. Can triangle patterns be used in intraday trading?
Yes, especially on 15-min or 1-hr charts for high-volume stocks and indices like NIFTY.
4. What’s the best tool to draw triangle patterns in India?
TradingView India offers excellent tools for drawing and saving triangle setups.
5. Should I trade before or after breakout?
Always trade after breakout confirmation to avoid traps and fakeouts.