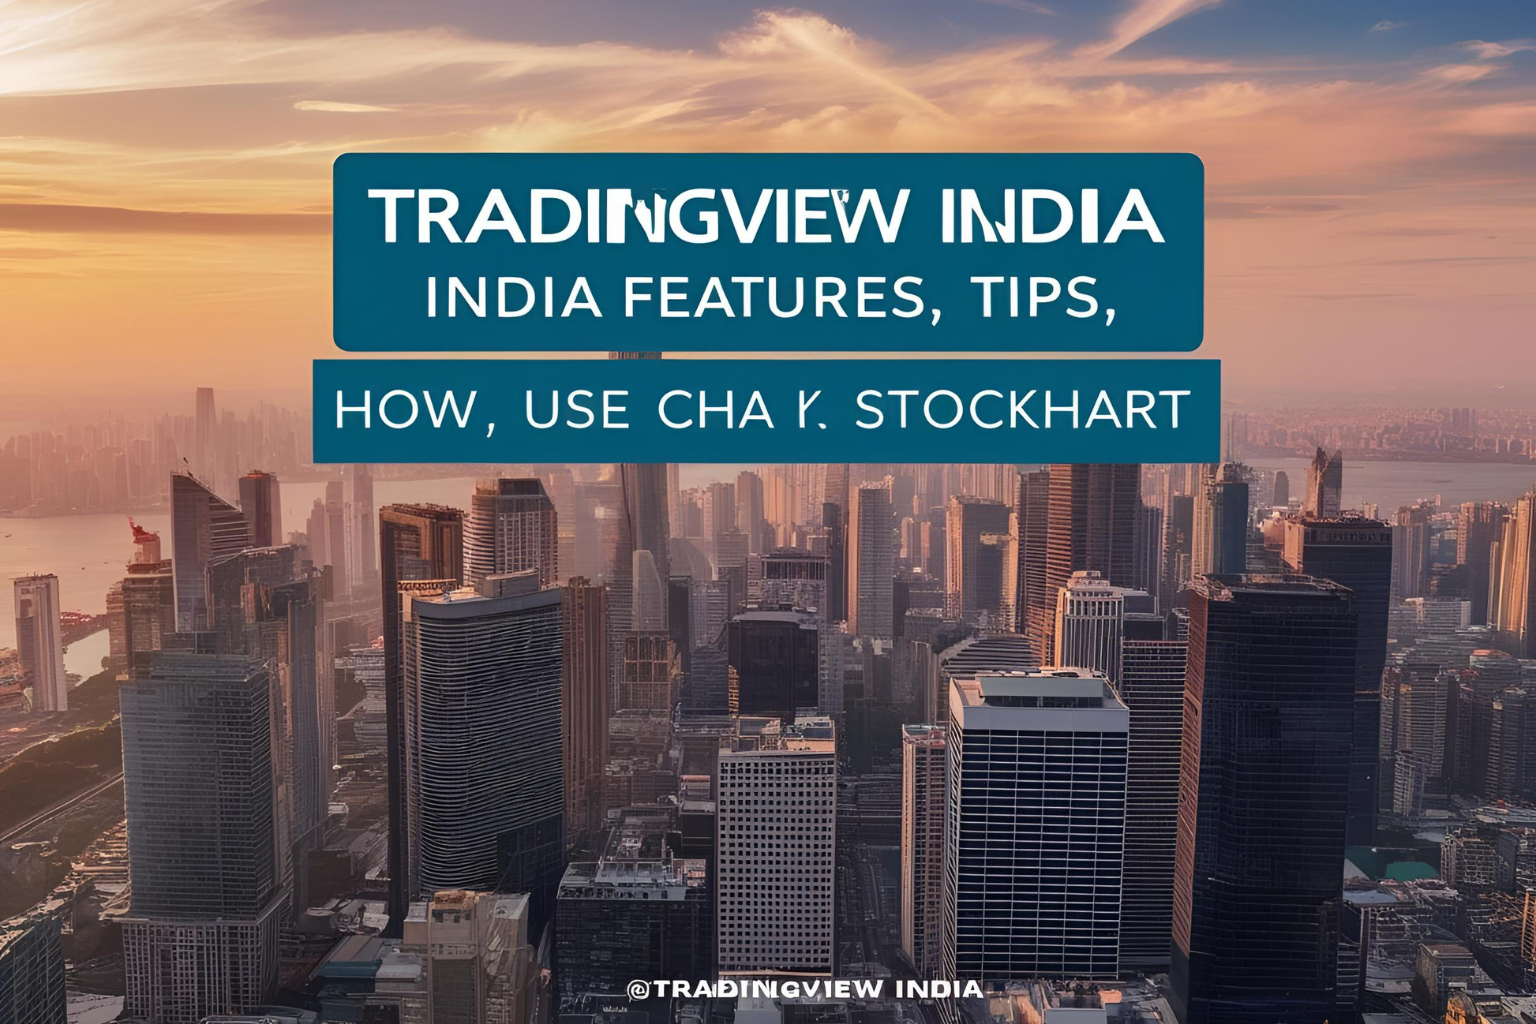
TradingView India: Features, Tips, and How to Use It for Stock Charts
TradingView India has become the go-to charting platform for Indian stock traders. Known for its clean interface, powerful indicators, and live data support, it caters to intraday, swing, and long-term traders. Whether you’re analyzing NIFTY, BANKNIFTY, or NSE stocks like Reliance and Infosys, TradingView offers unmatched flexibility. Here’s a complete guide on how to make the most of it.
What Is TradingView India?
TradingView is a cloud-based charting and analysis tool used globally. The India-specific version includes real-time data for NSE and BSE stocks, indices, and more. It also supports forex, crypto, and global markets.
The free version is powerful enough for most traders, while the Pro plans add extra tools and alerts.
Key Features for Indian Traders
| Feature | Details |
|---|---|
| Real-Time NSE Charts | Free access to NSE cash market data |
| 100+ Technical Indicators | RSI, MACD, Bollinger Bands, EMA, Supertrend, etc. |
| Drawing Tools | Trendlines, Fibonacci, Elliott Waves, Pitchforks |
| Multi-Timeframe Charts | Analyze 1-min to monthly timeframes |
| Custom Alerts | Set alerts for price, indicator conditions, or trendline breaks |
| Community Scripts | Access user-made indicators and strategies |
| Integration with Brokers | Some Indian brokers (like Dhan and Fyers) allow direct TradingView access |
How to Use TradingView India (Step-by-Step)
1. Visit the Site
Go to in.tradingview.com and create a free account.
2. Search for a Stock
Use the top bar to search NSE stocks like RELIANCE, HDFCBANK, or indices like NIFTY 50.
3. Launch Full Chart
Click “Full-featured chart” for advanced analysis tools and indicators.
4. Add Indicators
Click the “Indicators” tab and add tools like:
- RSI (Relative Strength Index)
- EMA (Exponential Moving Average)
- MACD
- Volume
- VWAP
5. Use Drawing Tools
Mark support, resistance, trendlines, or chart patterns using the toolbar on the left.
6. Set Alerts
Right-click on price or indicator → Set alert
You can be notified via email or app notification.
7. Save Layout
Save your chart layout so it loads every time you log in.
Tips for Indian Stock Charting
- Use 5-min to 15-min charts for intraday analysis
- Switch to daily or weekly charts for swing trading
- Watch pre-market levels and opening ranges
- Track BankNIFTY, NIFTY, and FINNIFTY for broader market clues
- Follow other Indian traders via the Ideas section
Free vs Paid: What’s Worth It?
| Feature | Free Plan | Pro/Pro+ Plans |
|---|---|---|
| Indicators per chart | 3 | 5–25 (depending on plan) |
| Saved layouts | 1 | Unlimited |
| Alerts | 1 | 10–400 alerts |
| Ads | Yes | No |
| Best For | Beginners | Active traders and analysts |
FAQs
1. Is TradingView India free to use?
Yes, it offers a robust free plan with real-time NSE charts and basic tools. Paid plans offer more features.
2. Can I place trades from TradingView India?
Yes, some brokers like Dhan and Fyers offer integration for live trading within TradingView.
3. What are the best indicators to use on TradingView?
Start with RSI, EMA, MACD, and Supertrend—all available in the free version.
4. Can I save my chart analysis in the free version?
Yes, but you can save only one layout. Paid users can save multiple custom setups.
5. Is TradingView good for Indian intraday traders?
Absolutely. It’s one of the best tools for intraday analysis, thanks to its responsiveness and customizability.