Volume Analysis Using Indian Stock Charts
Introduction
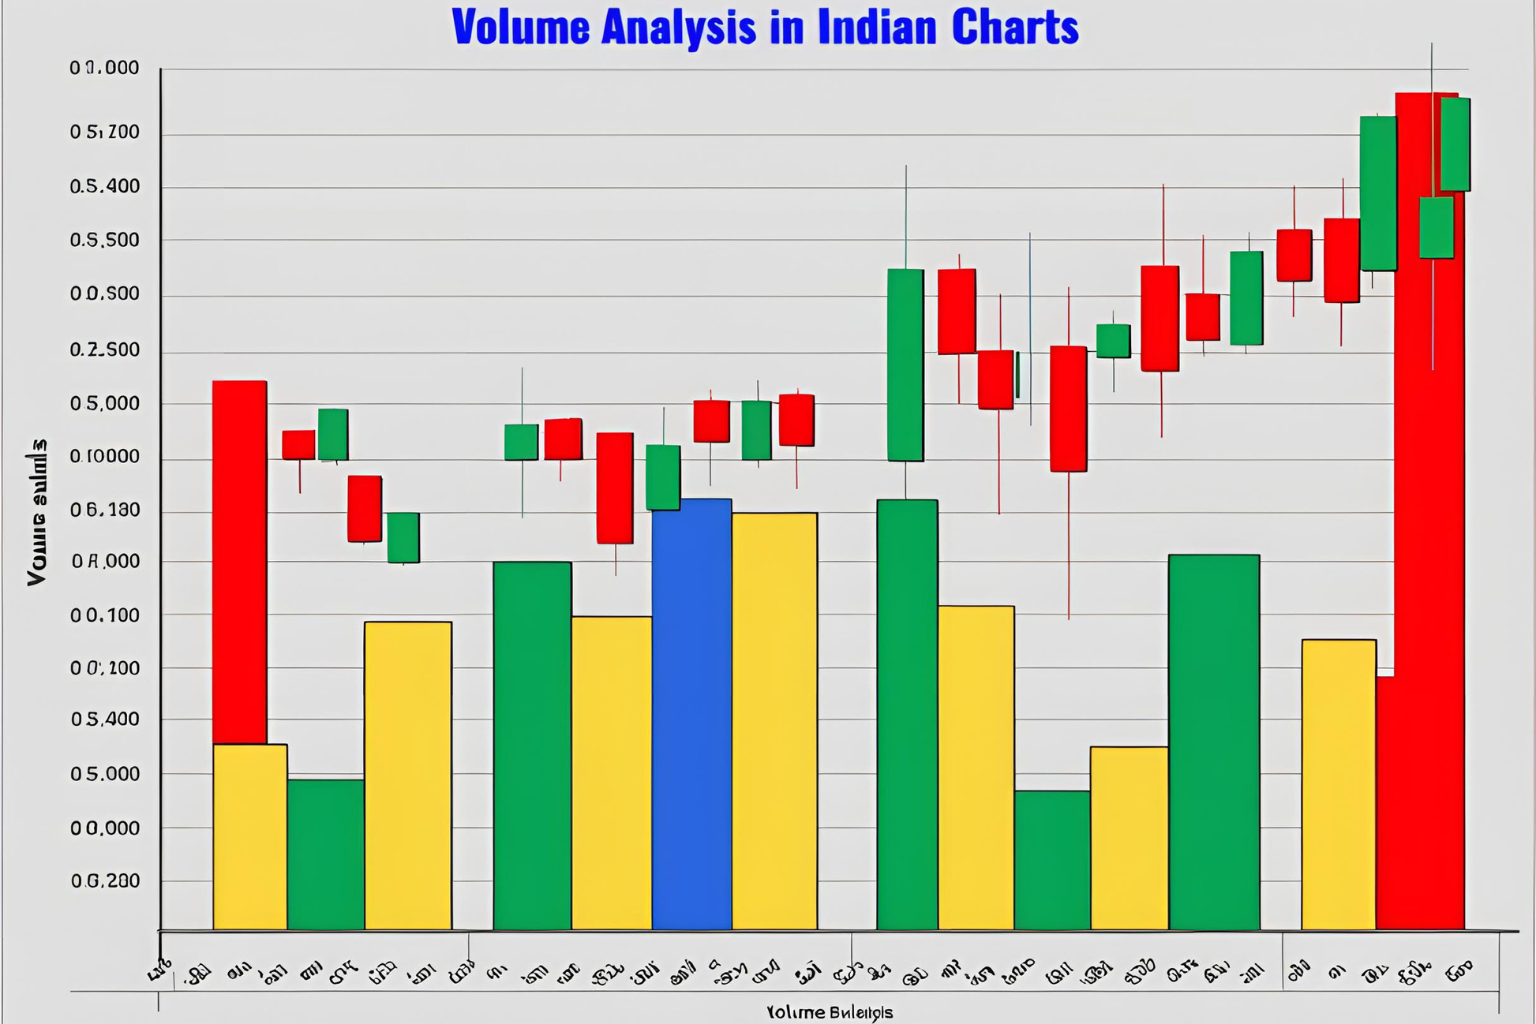
In the dynamic world of the Indian stock market, understanding market sentiment is key to making informed trading decisions. Volume analysis, a cornerstone of technical analysis, provides traders with insights into the strength of price movements. By examining the number of shares traded over a specific period, volume analysis helps confirm trends, identify reversals, and spot breakout opportunities. This blog explores how to use volume analysis effectively with Indian stock charts, offering practical tips for traders and investors.
Why Volume Matters
Volume represents the total number of shares or contracts traded for a stock within a given timeframe, such as a day, hour, or week. In the Indian stock market, where stocks like Reliance Industries, Tata Motors, and SBI dominate trading, volume acts as a critical indicator of market interest and liquidity.
- Trend Confirmation: High volume during a price increase signals strong buying interest, confirming an uptrend. Conversely, a price drop with high volume indicates strong selling pressure, confirming a downtrend.
- Breakouts and Reversals: A breakout above resistance with high volume suggests a genuine move, while low-volume breakouts may be false. Similarly, a price reversal with a spike in volume can signal a trend change.
- Liquidity: High-volume stocks like those in the Nifty 50 are preferred by institutional investors and intraday traders due to their ease of entry and exit.
For example, a surge in volume in State Bank of India (SBI) during a price rally often confirms bullish sentiment, while declining volume during a price drop may indicate a weakening downtrend.
Key Volume Indicators
Several volume-based indicators help traders analyze Indian stock charts. Here are four widely used ones:
1. On-Balance Volume (OBV)
OBV, developed by Joseph Granville, is a cumulative indicator that measures buying and selling pressure by adding volume on up days and subtracting it on down days. A rising OBV confirms an uptrend, while a falling OBV signals a downtrend.
Example: On a daily chart of Reliance Industries, if the stock closes higher with high volume, OBV increases, confirming bullish momentum. A divergence (e.g., price rising but OBV falling) may warn of a potential reversal.
2. Chaikin Money Flow (CMF)
Developed by Marc Chaikin, CMF measures money flow over a specific period (typically 21 days) by comparing the closing price to the high-low range, weighted by volume. Positive CMF indicates buying pressure, while negative CMF suggests selling pressure.
Example: In a chart of Tata Motors, a positive CMF during a price rally confirms strong buying interest, making it a potential buy signal.
3. Volume Moving Average (VMA)
VMA smooths volume data over a period (e.g., 20 days) to identify trends. A current volume above the VMA suggests strong interest, while a volume below the VMA indicates weak participation.
Example: If SBI’s daily volume spikes above its 20-day VMA during a price breakout, it confirms the move’s strength.
4. Volume Price Trend (VPT)
VPT combines price and volume to measure the strength of a price trend. It adds or subtracts a percentage of the volume based on the stock’s price direction.
Example: On a Bharat Heavy Electronics Ltd. (BHEL) chart, a rising VPT during a price uptrend confirms bullish momentum, while a declining VPT during a price drop signals bearish pressure.
Using Volume in Indian Stock Charts
Let’s explore how to apply volume analysis using Indian stock charts:
Case Study 1: Reliance Industries (Uptrend Confirmation)
On a daily chart of Reliance Industries, suppose the stock breaks above a resistance level of ₹2,800 with a significant increase in volume (e.g., 1.5x the 20-day average). This high volume confirms the breakout, suggesting a strong uptrend. Traders could enter a long position, targeting the next resistance level, with a stop-loss below ₹2,800.
Case Study 2: SBI (Reversal Signal)
Imagine SBI’s stock price declines to a support level of ₹600 on low volume, followed by a sharp price increase with a volume spike. This pattern indicates a potential reversal, as low selling pressure at the support level and high buying volume suggest buyers are stepping in. Traders could consider a buy position with a stop-loss below ₹600.
These examples highlight how volume analysis can guide trading decisions in the Indian market.
Combining Volume with Other Indicators
While volume is powerful, it’s most effective when combined with other technical tools:
- Price Action: Use candlestick patterns (e.g., bullish engulfing) with high volume to confirm entries.
- Moving Averages: A price crossing above a 50-day moving average with high volume strengthens the bullish signal.
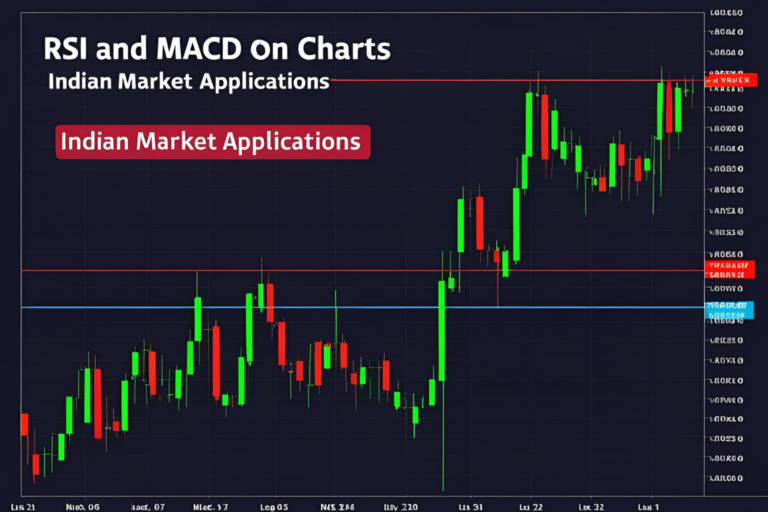
- Relative Strength Index (RSI): A divergence between RSI and volume (e.g., RSI rising but volume falling) may signal a weakening trend.
- Volume Weighted Average Price (VWAP): VWAP helps intraday traders assess whether they’re buying/selling at favorable prices relative to the day’s average.
For instance, combining OBV with RSI on a Tata Steel chart can help confirm whether a breakout is supported by both momentum and volume.
Tips for Effective Volume Analysis
- Compare with Historical Volume: Always compare current volume to the stock’s historical average to gauge significance.
- Focus on Key Levels: Pay attention to volume surges at support, resistance, or breakout levels.
- Use Multiple Timeframes: Analyze volume on daily and intraday charts to align short- and long-term trends.
- Avoid Over-Reliance: Combine volume with price action and fundamental analysis for a holistic approach.
- Leverage Charting Tools: Platforms like TradingView, Zerodha Kite, or StockEdge offer robust volume analysis tools for Indian stocks.
Conclusion
Volume analysis is a vital tool for navigating the Indian stock market, offering insights into market sentiment, trend strength, and potential reversals. By mastering indicators like OBV, CMF, VMA, and VPT, and combining them with price action and other technical tools, traders can make informed decisions. Whether you’re trading blue-chip stocks like Reliance Industries or mid-cap names like Bharat Heavy Electronics, volume analysis can enhance your strategy. Start incorporating volume into your trading today and unlock the power of Indian stock charts!