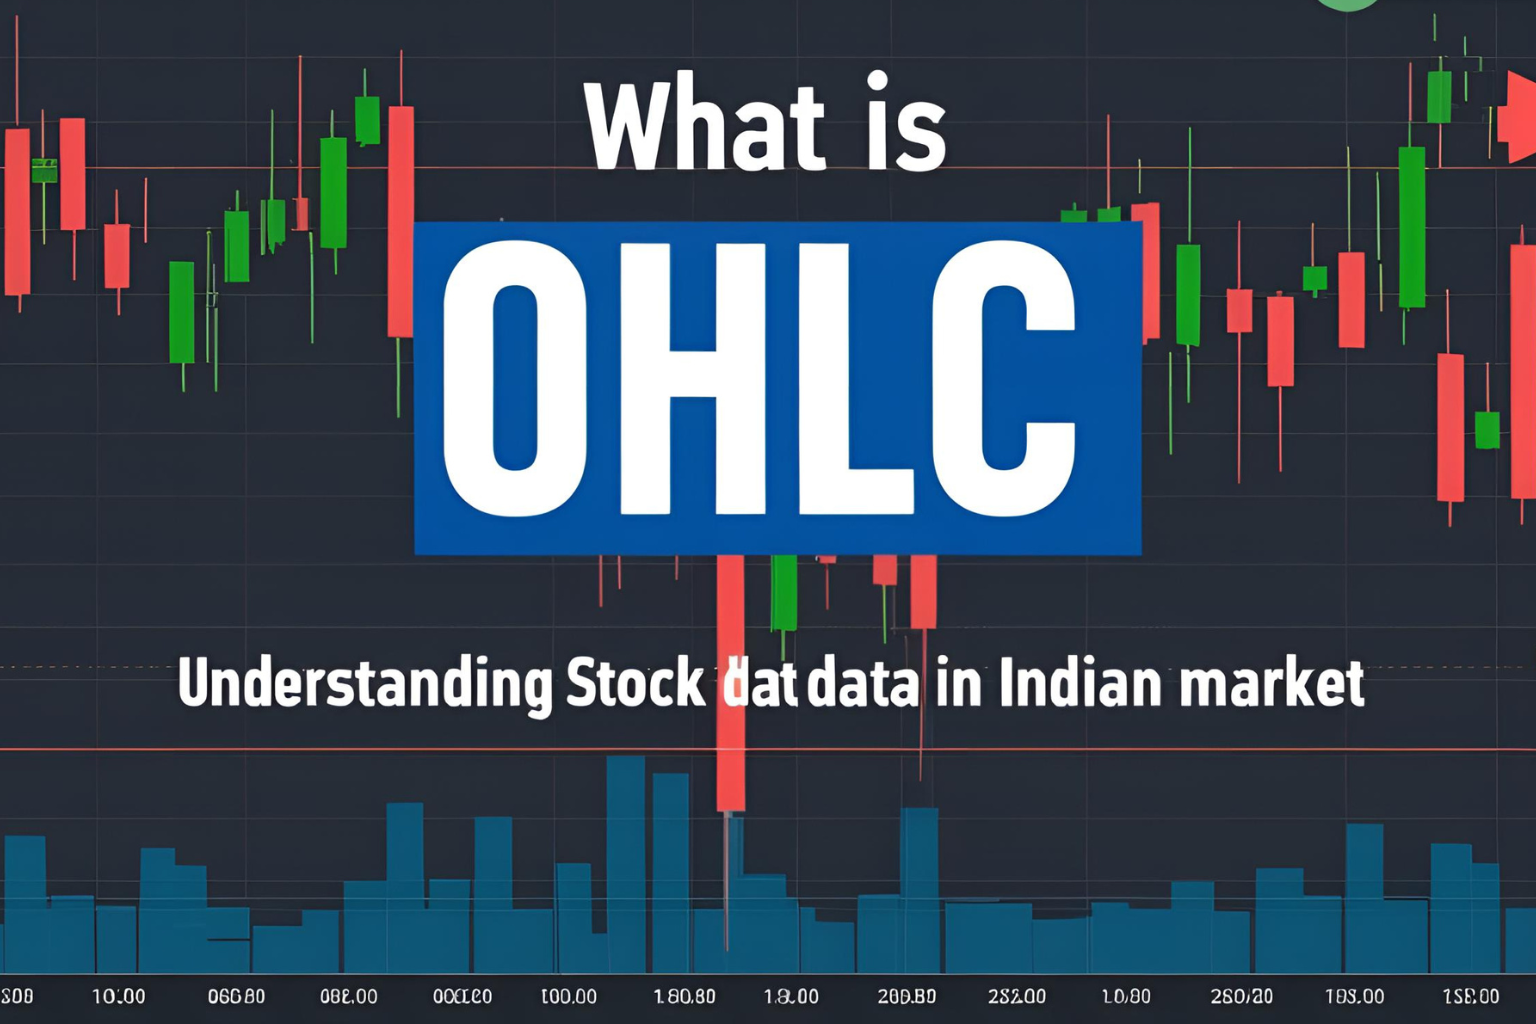
What Is OHLC? Understanding Stock Chart Data in Indian Market
If you’ve ever opened a stock chart in Zerodha Kite, Upstox Pro, or TradingView India, you’ve likely seen the term OHLC displayed next to stock prices. OHLC stands for Open, High, Low, Close—and it’s one of the most important data formats for Indian traders.
This guide will help you understand what OHLC means, how to read it, and how to apply it in your stock trading decisions.
What Does OHLC Stand For?
| Term | Description |
|---|---|
| Open | The price at which the stock starts trading for the day or specific time frame |
| High | The highest price reached during that period |
| Low | The lowest price reached during that period |
| Close | The final price at which the stock ends for that time frame |
These four points are usually represented by candlesticks or bar charts.
Example: OHLC for Infosys on a 1-Day Chart
- Open: ₹1,520
- High: ₹1,540
- Low: ₹1,510
- Close: ₹1,535
This tells us that Infosys opened at ₹1,520, dropped as low as ₹1,510, peaked at ₹1,540, and finally closed at ₹1,535.
Why OHLC Data Matters for Indian Traders
- Identifying Market Sentiment
- If Close > Open → Bullish
- If Close < Open → Bearish
- Spotting Price Action Patterns
Candlestick formations like Doji, Hammer, or Engulfing rely on OHLC data. - Backtesting Strategies
Most technical strategies (moving averages, MACD, RSI) use OHLC values. - Intraday and Positional Trading
Whether you’re using 5-min charts for intraday or weekly charts for swing trading, OHLC data helps define entry/exit levels.
Where to View OHLC on Indian Charting Platforms
| Platform | OHLC Display | Candlestick Support |
|---|---|---|
| Zerodha Kite | Yes | Yes |
| TradingView India | Yes | Yes |
| Upstox Pro | Yes | Yes |
| Chartink | Yes | Yes |
Look for the top left or top bar of your chart to see real-time OHLC data.
OHLC and Candlestick Charts
Candlesticks are a visual representation of OHLC data:
- Body = Open to Close
- Wicks = High and Low
- Color: Green for Close > Open, Red for Close < Open
FAQs
1. What does OHLC mean in a stock chart?
It stands for Open, High, Low, Close—the key data points that form each candle or bar on a chart.
2. Is OHLC data available on Indian stock platforms?
Yes, it’s visible by default on platforms like Zerodha Kite, TradingView India, and Upstox Pro.
3. How is OHLC used in intraday trading?
Intraday traders use 5-min or 15-min OHLC candles to analyze volatility and breakout potential.
4. Do indicators use OHLC values?
Yes, most indicators like Moving Averages, RSI, and MACD use Close or combinations of OHLC for calculation.
5. Is OHLC better than line charts?
Yes, OHLC provides a full picture of price behavior, while line charts only show closing prices.

