Best Chart Patterns for Indian Stock Traders
Chart patterns are essential tools in technical analysis, helping Indian stock traders predict market direction, manage risk, and improve entry and exit timing. Whether you trade intraday, swing, or positional, mastering a few key patterns can significantly boost your confidence and trading results.
Here are the most effective chart patterns every Indian trader should know—along with practical examples from the NSE market.
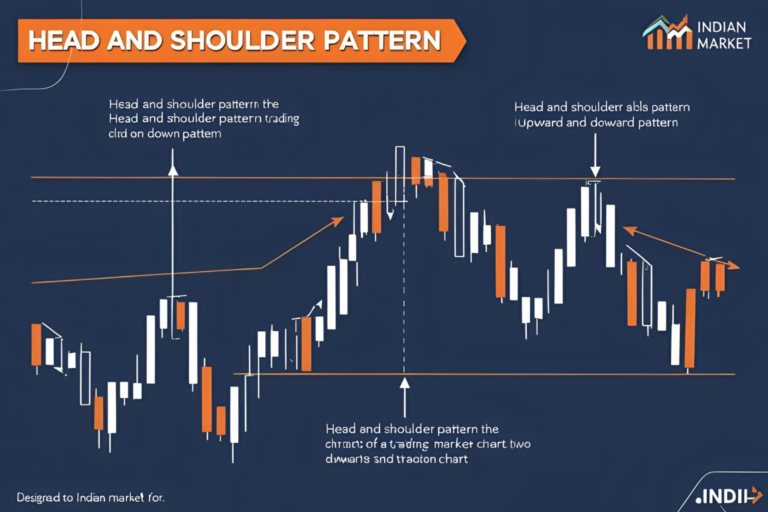
1. Head and Shoulders
Type: Reversal (Bearish)
Use: Detects the end of an uptrend
Confirmation: Break of neckline with volume
Example: A Head & Shoulders pattern on Infosys with a neckline break below ₹1,350 may signal a trend reversal.
2. Double Top and Double Bottom
Type: Reversal
- Double Top: Bearish reversal after two failed highs
- Double Bottom: Bullish reversal after two failed lows
Seen often in stocks like HDFC Bank, especially around psychological resistance/support levels.
3. Cup and Handle
Type: Bullish Continuation
Structure: Rounded base followed by a short consolidation handle
Breakout: Above handle with volume spike
TCS forming a Cup and Handle above ₹3,700 often signals strong upward momentum.
4. Triangles (Ascending, Descending, Symmetrical)
Type: Continuation or Reversal
- Ascending: Bullish breakout expected
- Descending: Bearish breakdown likely
- Symmetrical: Watch for breakout direction
Great for intraday breakout trades in Tata Steel, Axis Bank, and BankNIFTY.
5. Flag and Pennant
Type: Continuation (Bullish or Bearish)
Timeframe: Works well in intraday or hourly charts
Trigger: Breakout in the trend direction with increased volume
Use in trending stocks like Reliance and ICICI Bank during strong rallies.
6. Rectangle Pattern
Type: Consolidation
Setup: Stock moves between horizontal support and resistance
Signal: Breakout or breakdown from the range
Works best in sideways markets. Example: Maruti trading between ₹9,600–₹10,200.
7. Wedge Patterns
- Falling Wedge: Bullish reversal
- Rising Wedge: Bearish reversal
Look for: Converging trendlines and breakout direction
How to Trade Patterns Effectively
- Confirm with Volume: Patterns with volume breakout are more reliable
- Use Indicators: Combine with RSI, MACD, or EMA for confirmation
- Set Entry & SL: Entry after breakout; SL below/above pattern boundaries
- Backtest: Apply patterns on past charts of NIFTY or NSE 500 stocks
FAQs
1. Do chart patterns really work in Indian markets?
Yes, especially on liquid stocks and indices like NIFTY and BANKNIFTY with strong volume participation.
2. What timeframe is best for pattern trading?
Use 15-min and hourly charts for intraday, and daily charts for swing or positional trades.
3. Are these patterns beginner-friendly?
Yes. Start with simple ones like Double Bottom, Triangle, and Flag before exploring advanced ones.
4. Can I combine chart patterns with indicators?
Absolutely. Combining patterns with volume, RSI, or moving averages improves accuracy.
5. Which platforms support pattern-based trading?
TradingView India, Zerodha Kite, and Chartink all support chart drawing and pattern recognition.