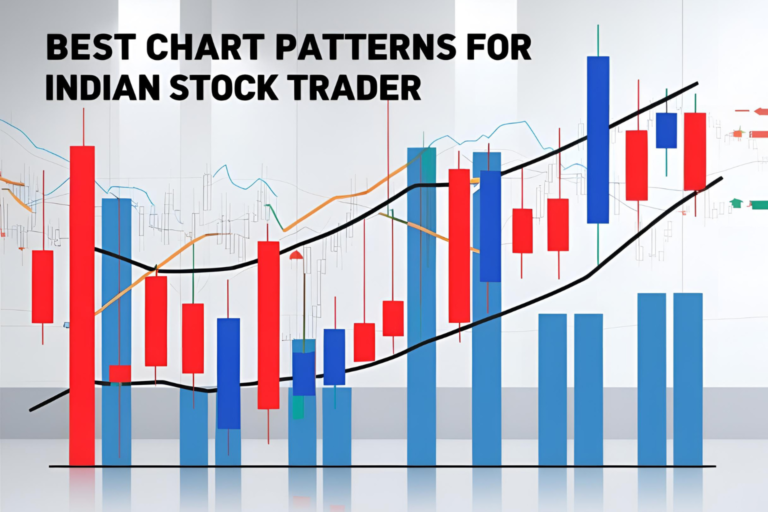
Best Chart Patterns for Indian Stock Traders
Chart patterns are essential tools in technical analysis, helping Indian stock traders predict market direction, manage risk, and improve entry and exit timing. Whether you trade intraday, swing, or positional, mastering a few key patterns can significantly boost your confidence and trading results. Here are the most effective chart patterns every Indian trader should know—along…