Chartink Screener: How to Use It with Indian Stock Charts
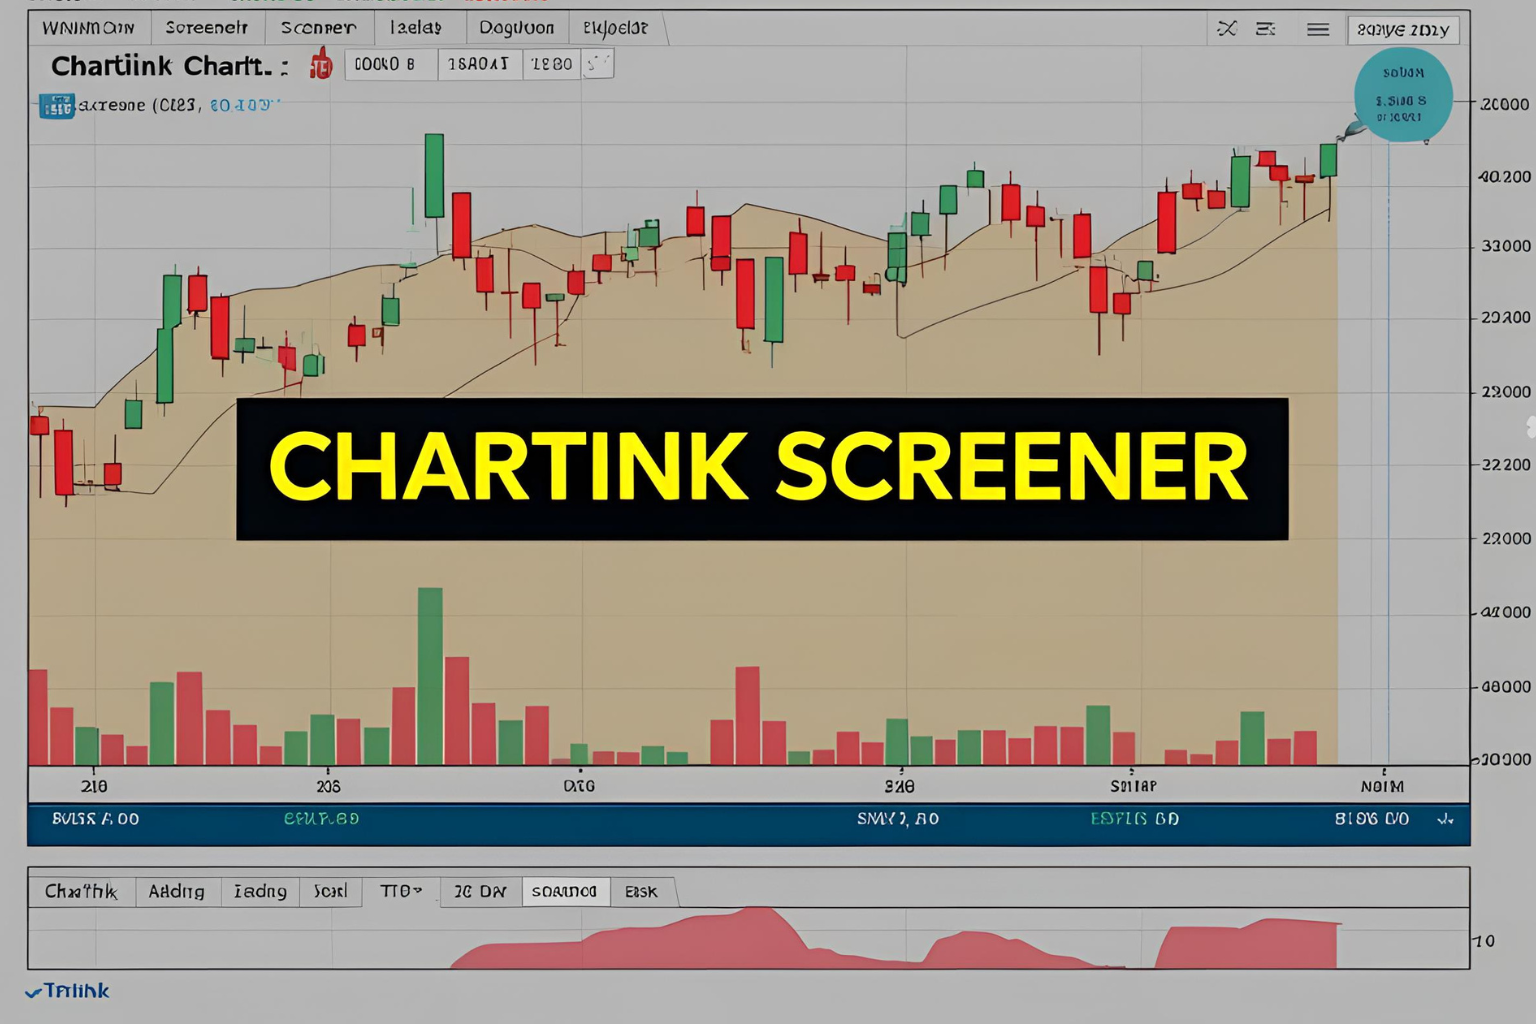
Chartink.com is one of the most popular stock screening tools for Indian traders. It allows users to scan stocks based on technical conditions using real-time and end-of-day (EOD) data. With Chartink, you can combine custom technical rules and quickly spot opportunities across NSE and BSE. In this guide, you’ll learn how to use Chartink with Indian stock charts for better trading decisions.
What Is Chartink?
Chartink is a free, web-based stock screener that provides:
- Custom screening logic (no coding needed)
- Live NSE cash and F&O stock data
- Ready-made screeners and chart visuals
- Ability to filter based on indicators like RSI, MACD, EMA, Bollinger Bands, etc.
It’s widely used by swing traders, intraday traders, and even beginners in India.
Why Indian Traders Love Chartink
- No registration required for basic features
- Customizable screener logic builder
- Supports live & EOD scans
- Covers NSE stocks, indices, and sectoral data
Whether you’re looking for bullish breakouts or RSI oversold conditions, Chartink helps automate your watchlist.
How to Use Chartink Screener (Step-by-Step)
Step 1: Visit Chartink.com
Go to www.chartink.com – no login needed for basic screening.
Step 2: Explore Ready-Made Screeners
Use screeners like:
- Breakout above resistance
- RSI below 30
- Bullish Engulfing candle
These are shown with live market updates.
Step 3: Create a Custom Screener
Use the logic builder to combine technical rules.
Example:
- Close > 50 EMA
- RSI(14) < 40
- MACD crossover bullish
You can save the screener and get daily alerts via paid plans.
Step 4: View Matching Stocks with Chart
Once you run the screener:
- A list of stocks appears with chart icons
- Click the chart icon to view historical charts of that stock
- You can toggle between daily, weekly, and intraday charts
Example: Run a screener for “Price crossing above 200 EMA” and analyze stocks like HDFC or Infosys.
Step 5: Export or Monitor Results
- Export the stock list to Excel
- Track the results at day’s end or set alerts via premium plans
Popular Use Cases for Chartink in India
| Use Case | Indicator Example |
|---|---|
| Swing Trading | RSI + EMA Crossovers |
| Intraday Breakouts | Price > High of Last 5 Candles |
| Trend Reversal Detection | MACD crossover + Volume surge |
| Sector Screening | Scan NIFTY IT, NIFTY BANK only |
FAQs
1. Is Chartink free for Indian traders?
Yes, most features are free. Real-time alerts and premium scanning need a paid plan.
2. Can I screen for intraday stocks using Chartink?
Yes. You can use the intraday scanner feature to get 5-min/15-min breakout signals.
3. Does Chartink provide real-time data?
Yes, real-time scanning is available under paid subscriptions. EOD scanning is free.
4. Is Chartink better than TradingView?
Chartink is great for screening, while TradingView is better for charting and indicators. They can be used together.
5. Can I create alerts on Chartink?
Yes, the premium version lets you set up email/telegram alerts based on your custom screener.


