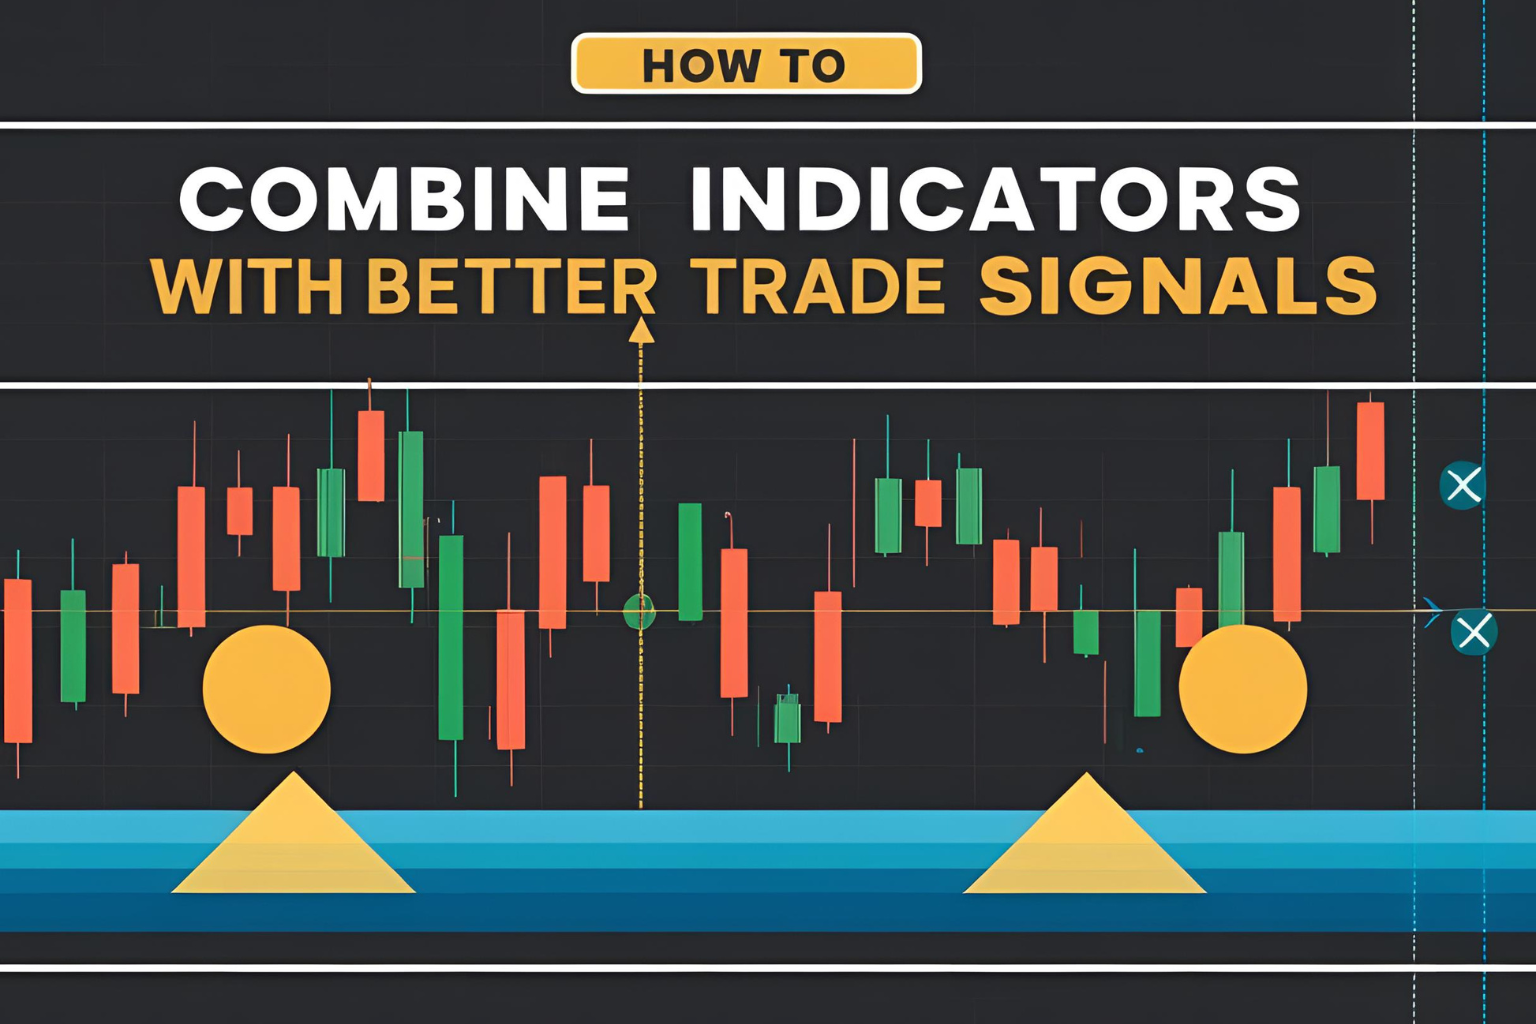
How to Combine Indicators with Chart Patterns for Better Trade Signals
Chart patterns help traders identify market psychology, while technical indicators offer statistical confirmation. When used together, they create powerful trade setups—especially in the fast-moving Indian stock market. In this guide, we’ll explore how to combine indicators with chart patterns to generate high-probability trading signals for Indian stocks.
Why Combine Chart Patterns with Indicators?
- Chart patterns (like Head & Shoulders, Double Top, Triangles) reveal price behavior
- Indicators (like RSI, MACD, Volume, Moving Averages) confirm momentum, strength, or trend
- The combination helps filter false breakouts and improve timing
Step-by-Step: How to Combine Effectively
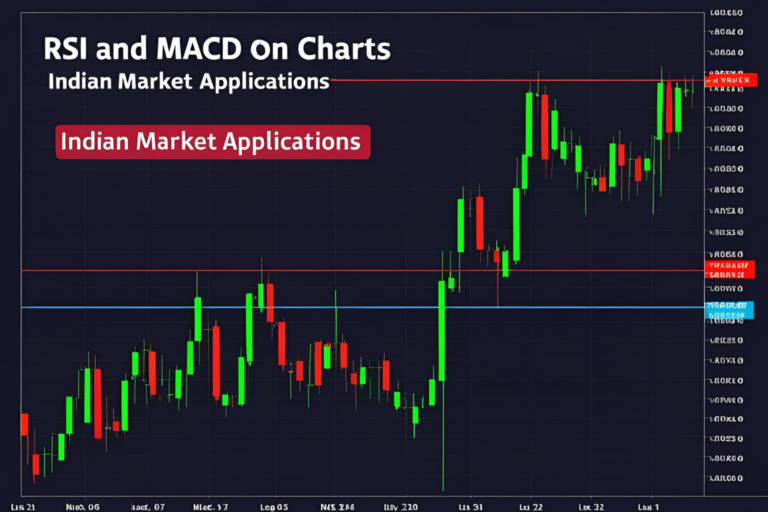
1. Use RSI with Reversal Patterns
- Pattern: Double Bottom / Hammer
- Indicator: RSI
- Signal: Enter long when the pattern forms and RSI rises from oversold (<30)
Example: A Hammer candle with RSI moving above 30 on SBI’s daily chart = strong buy signal
2. MACD with Head & Shoulders Pattern
- Pattern: Head & Shoulders
- Indicator: MACD
- Signal: Confirm a short position when MACD line crosses below signal line during the neckline break
Works well on BANKNIFTY and stocks like ICICI Bank
3. Moving Averages with Triangles
- Pattern: Symmetrical Triangle Breakout
- Indicator: 50 EMA
- Signal: Confirm breakout when price is above the 50 EMA and breaks triangle resistance
Combine this on 15-min charts for intraday stocks like Tata Steel, Infosys
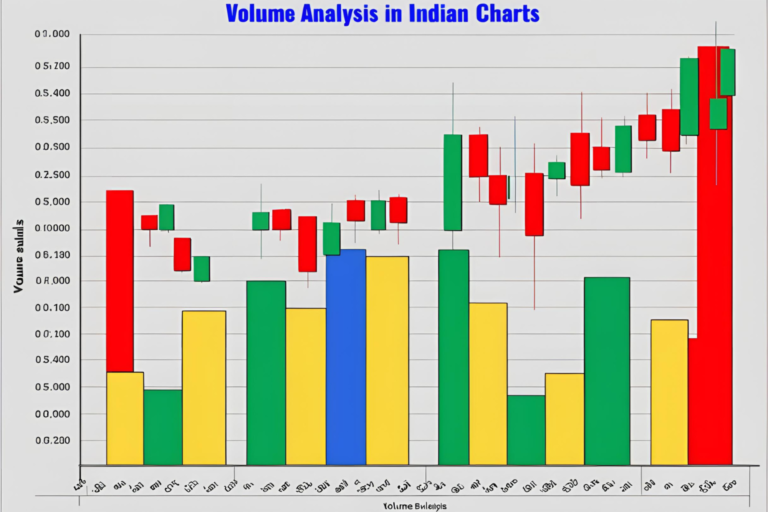
4. Volume with Breakout Patterns
- Pattern: Ascending Triangle
- Indicator: Volume
- Signal: Breakout confirmation if volume increases significantly on the breakout candle
Chartink and TradingView India both show volume overlays for this setup
5. Bollinger Bands with Flag Patterns
- Pattern: Bull Flag
- Indicator: Bollinger Bands
- Signal: Look for breakout beyond the upper band from a narrow flag pattern
Suitable for trending stocks like TCS or Reliance
Best Practices for Indian Traders
- Don’t force indicators on every setup—use them for confirmation
- Avoid using multiple indicators that tell the same story (e.g., MACD + RSI + Stochastic)
- Backtest your strategy with historical Indian stock data before using real capital
- Stick to high-volume stocks (NSE F&O stocks) for better reliability
FAQs
1. Why combine indicators with chart patterns?
It helps validate a setup and avoid false signals by confirming trend strength or reversals.
2. What is the best indicator to use with patterns in Indian stocks?
RSI and MACD are reliable, but volume and moving averages work great when analyzing breakouts.
3. Can I use these combinations on TradingView India?
Yes, TradingView India allows you to overlay indicators and draw patterns interactively.
4. Is it suitable for intraday trading in India?
Yes, especially when applied on 5-min or 15-min charts for liquid stocks like Reliance, HDFC, and NIFTY.
5. Do beginners need to learn both indicators and patterns?
Yes. Start simple—learn basic patterns and confirm with 1–2 indicators for better trade accuracy.