Head and Shoulders Pattern: How to Trade It in Indian Market
The Head and Shoulders pattern is one of the most reliable chart patterns used in technical analysis. It signals a potential trend reversal and helps traders make strategic entry and exit decisions. In the Indian market, this pattern is frequently seen in NIFTY stocks, banking stocks, and F&O equities.
This guide will explain how to identify, trade, and manage risk using the Head and Shoulders pattern in the context of Indian stocks.
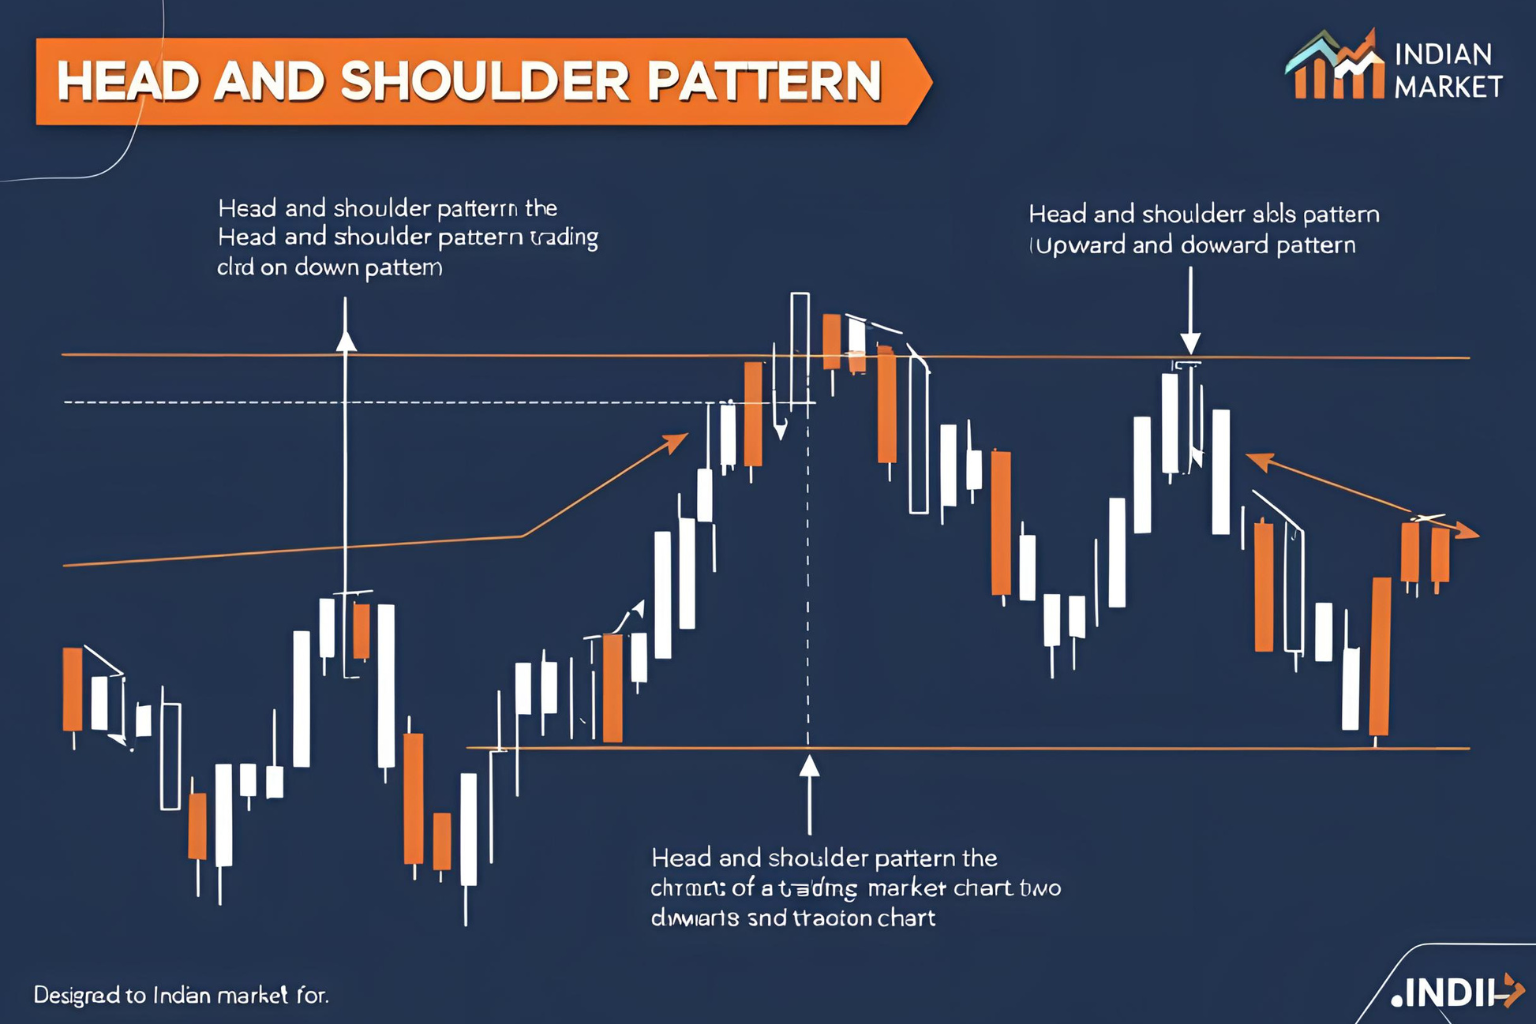
What Is the Head and Shoulders Pattern?
It’s a bearish reversal pattern that typically forms at the end of an uptrend.
- Left Shoulder: Price rises, then pulls back
- Head: Price rises higher, then declines
- Right Shoulder: Price rises again but stays below the head
- Neckline: Support level connecting the lows between the shoulders
Once the neckline is broken, it signals a potential downtrend.
Key Features of the Pattern
| Component | Role |
|---|---|
| Left Shoulder | First peak |
| Head | Highest peak |
| Right Shoulder | Lower high, confirming weakness |
| Neckline | Break confirms the sell signal |
How to Identify the Pattern in Indian Stocks
- Use daily or hourly charts of NSE stocks like Reliance, ICICI Bank, or HDFC Bank
- Look for three peaks where the middle one (the head) is the highest
- Draw a neckline through the two low points between the shoulders
- Confirm the pattern with volume—ideally falling on the right shoulder and spiking on the breakdown
Example: Head and Shoulders in HDFC Bank
- Left Shoulder: ₹1,640
- Head: ₹1,700
- Right Shoulder: ₹1,650
- Neckline: ₹1,620
- Breakdown Target: ₹1,540 (head – neckline)
How to Trade It in Indian Market
Entry Point
- Enter short after a confirmed breakdown below the neckline
- Use a closing basis for confirmation, not intraday wicks
Target Calculation
- Target = Height from head to neckline, subtracted from breakdown point
Stop Loss
- Above the right shoulder or above neckline (if conservative)
Inverse Head and Shoulders (Bullish Variant)
- Appears after a downtrend
- Indicates a bullish reversal
- Trade setup is the same, but direction is long after neckline breakout
Example: Seen in BANKNIFTY before major reversals
FAQs
1. Is the head and shoulders pattern reliable in Indian stocks?
Yes, it’s one of the most reliable reversal patterns when combined with volume confirmation.
2. Which timeframe is best for this pattern?
Daily and hourly charts work best for swing trading in Indian stocks.
3. Can I use this pattern in intraday trading?
Yes, but false breakouts are common. Confirm with volume and use tight risk management.
4. Is the inverse head and shoulders pattern bullish?
Yes, it signals a potential uptrend after a prolonged downtrend.
5. Which Indian platforms are best to spot this pattern?
TradingView India, Zerodha Kite, and Upstox Pro support easy chart drawing and analysis.