Line, Bar, and Candlestick Charts: Which One to Use in India?
Stock charts come in many forms, but the most commonly used types by Indian traders are line, bar (OHLC), and candlestick charts. Each offers a different level of detail and visual interpretation. This guide compares all three to help you choose the right chart type based on your trading or investing style in India.
1. Line Charts
Overview:
A line chart connects closing prices over a selected time period. It’s clean, simple, and best suited for long-term trend tracking.
Pros:
- Very easy to read
- Great for beginners and investors
- Highlights overall price direction
Cons:
- Ignores open, high, low data
- Not ideal for intraday or technical analysis
Use Case in India:
- Long-term investors tracking SBI, Infosys, or NIFTY 50 trends.
2. Bar Charts (OHLC)
Overview:
Each bar shows open, high, low, and close for a time frame. Vertical lines represent the range; small left/right ticks show open/close.
Pros:
- More data than line charts
- Good for spotting volatility and price ranges
Cons:
- Can be visually confusing for beginners
- Hard to spot patterns at a glance
Use Case in India:
- Analysts studying midcap volatility or support/resistance levels in stocks like Tata Motors.
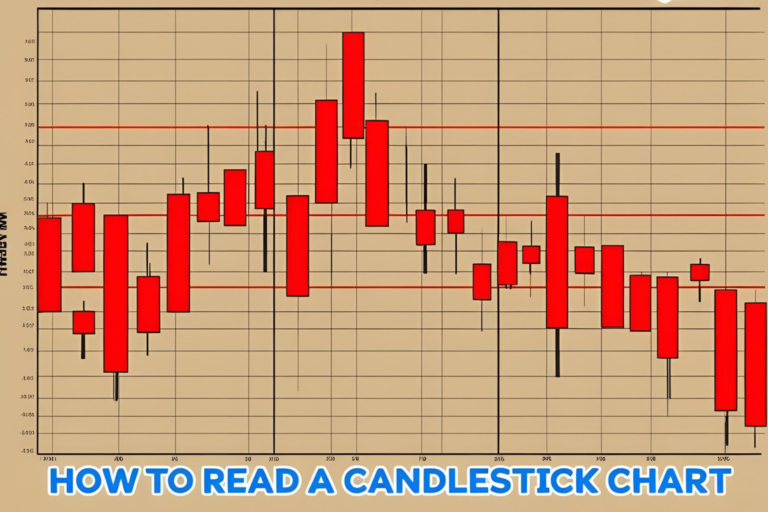
3. Candlestick Charts
Overview:
Candlesticks also show OHLC data, but in a color-coded and visually clear format. A filled/red candle = price down; green/empty candle = price up.
Pros:
- Easiest to interpret patterns
- Popular among Indian traders
- Suitable for all timeframes
Cons:
- Slight learning curve initially
Use Case in India:
- Intraday and swing traders analyzing HDFC Bank, Reliance, or BANKNIFTY on platforms like TradingView and Zerodha Kite.
Visual Comparison
| Feature | Line Chart | Bar Chart | Candlestick Chart |
|---|---|---|---|
| Shows OHLC | ❌ | ✅ | ✅ |
| Beginner-Friendly | ✅ | ❌ | ✅ (after basics) |
| Pattern Visibility | ❌ | ❌ | ✅ |
| Intraday Suitability | ❌ | ✅ | ✅ |
| Preferred by Indian Traders | ✅ (Investors) | ✅ (Analysts) | ✅ (All Traders) |
Which Chart Type Should You Use?
| Trader Type | Recommended Chart Type |
|---|---|
| Long-Term Investor | Line or Candlestick Chart |
| Intraday Trader | Candlestick Chart |
| Swing Trader | Candlestick or Bar Chart |
| Technical Analyst | Bar or Candlestick Chart |
FAQs
1. Which chart type is best for Indian intraday traders?
Candlestick charts are the most popular due to their clarity and pattern recognition.
2. Are bar charts used often in India?
Less commonly now, but still used by professional analysts who prefer detailed OHLC views.
3. Can beginners start with line charts?
Yes. Line charts are good for getting comfortable with stock trends before moving to candlesticks.
4. Where can I view these charts for Indian stocks?
Platforms like TradingView India, Zerodha Kite, Upstox Pro, and Chartink support all chart types.
5. Do all Indian stocks work well with candlestick charts?
Yes, especially liquid NSE stocks and indices. Illiquid stocks may give misleading patterns.