TradingView India: Features, Tips, and How to Use It for Stock Charts

TradingView India: Features, Tips, and How to Use It for Stock Charts

TradingView India has become the go-to charting platform for Indian stock traders. Known for its clean interface, powerful indicators, and live data support, it caters to intraday, swing, and long-term traders. Whether you’re analyzing NIFTY, BANKNIFTY, or NSE stocks like Reliance and Infosys, TradingView offers unmatched flexibility. Here’s a complete guide on how to make…

Best Charting Software for Indian Traders (2025 Edition)

Best Charting Software for Indian Traders (2025 Edition)

Whether you’re an intraday trader, swing trader, or long-term investor, having the right charting software is crucial for success in the Indian stock market. With so many tools available, choosing the best one can be overwhelming. This 2025 guide highlights the top charting software used by Indian traders, based on features, ease of use, and…

Triangle Chart Patterns in Indian Stocks: A Complete Guide

Triangle Chart Patterns in Indian Stocks: A Complete Guide

Triangle chart patterns are powerful tools in technical analysis. Commonly observed in Indian stocks like Reliance, HDFC Bank, and NIFTY 50, triangle formations help traders anticipate breakouts and trend continuation. This guide explains the types of triangle patterns, how to identify them on Indian stock charts, and strategies for trading them effectively. What Is a…

Head and Shoulders Pattern

Head and Shoulders Pattern: How to Trade It in Indian Market

The Head and Shoulders pattern is one of the most reliable chart patterns used in technical analysis. It signals a potential trend reversal and helps traders make strategic entry and exit decisions. In the Indian market, this pattern is frequently seen in NIFTY stocks, banking stocks, and F&O equities. This guide will explain how to…

Support and Resistance on Stock Charts

How to Use Support and Resistance on Stock Charts

Support and resistance levels are two of the most fundamental concepts in technical analysis. For Indian stock traders, understanding these levels can greatly improve trade entries, exits, and stop-loss placement. In this guide, we’ll explain what support and resistance mean, how to identify them on stock charts, and how to use them in real Indian…

Chart Timeframes Explained: Intraday to Weekly in Indian Market

Chart Timeframes Explained: Intraday to Weekly in Indian Market

One of the most important decisions an Indian trader must make when analyzing a stock chart is choosing the right timeframe. Different timeframes serve different trading styles—whether you’re looking to scalp quick intraday moves or hold a position for a week. This guide will help you understand how chart timeframes work in India and how…

Line, Bar, and Candlestick Charts Which One to Use in India

Line, Bar, and Candlestick Charts: Which One to Use in India?

Stock charts come in many forms, but the most commonly used types by Indian traders are line, bar (OHLC), and candlestick charts. Each offers a different level of detail and visual interpretation. This guide compares all three to help you choose the right chart type based on your trading or investing style in India. 1….

What Are Stock Charts? A Beginner’s Guide for Indian Traders

What Are Stock Charts? A Beginner’s Guide for Indian Traders

If you’re just starting your journey in the Indian stock market, understanding stock charts is one of the most important skills you can develop. Stock charts are visual tools that help traders and investors track price movements, analyze trends, and make better decisions. In this beginner’s guide, we’ll break down what stock charts are, how…

Best Chart Patterns for Indian Stock Traders

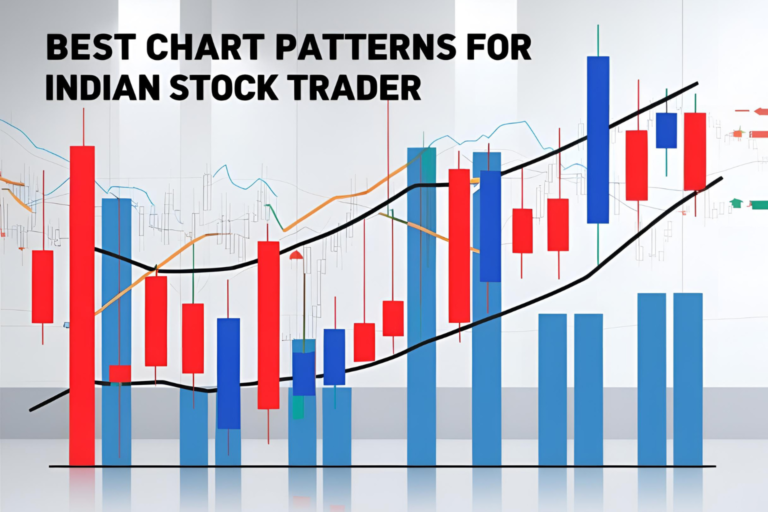
Best Chart Patterns for Indian Stock Traders

Chart patterns are essential tools in technical analysis, helping Indian stock traders predict market direction, manage risk, and improve entry and exit timing. Whether you trade intraday, swing, or positional, mastering a few key patterns can significantly boost your confidence and trading results. Here are the most effective chart patterns every Indian trader should know—along…

Read a Candlestick Chart

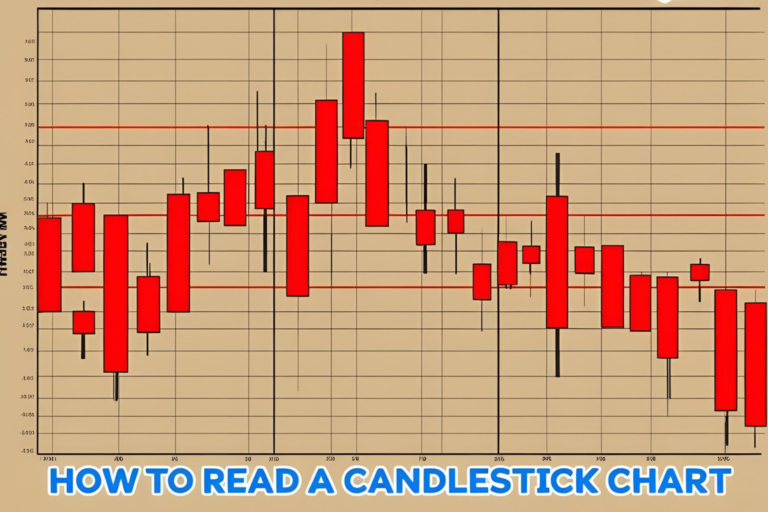
How to Read a Candlestick Chart: Step-by-Step (Indian Stocks)

Candlestick charts are one of the most powerful tools in technical analysis. Used widely by Indian traders across platforms like Zerodha Kite, Upstox Pro, and TradingView India, candlestick charts visually display price action and help spot trading opportunities. This beginner-friendly guide walks you through how to read candlestick charts with Indian stock market examples. What…