How to Read a Candlestick Chart: Step-by-Step (Indian Stocks)
Candlestick charts are one of the most powerful tools in technical analysis. Used widely by Indian traders across platforms like Zerodha Kite, Upstox Pro, and TradingView India, candlestick charts visually display price action and help spot trading opportunities. This beginner-friendly guide walks you through how to read candlestick charts with Indian stock market examples.
What Is a Candlestick Chart?
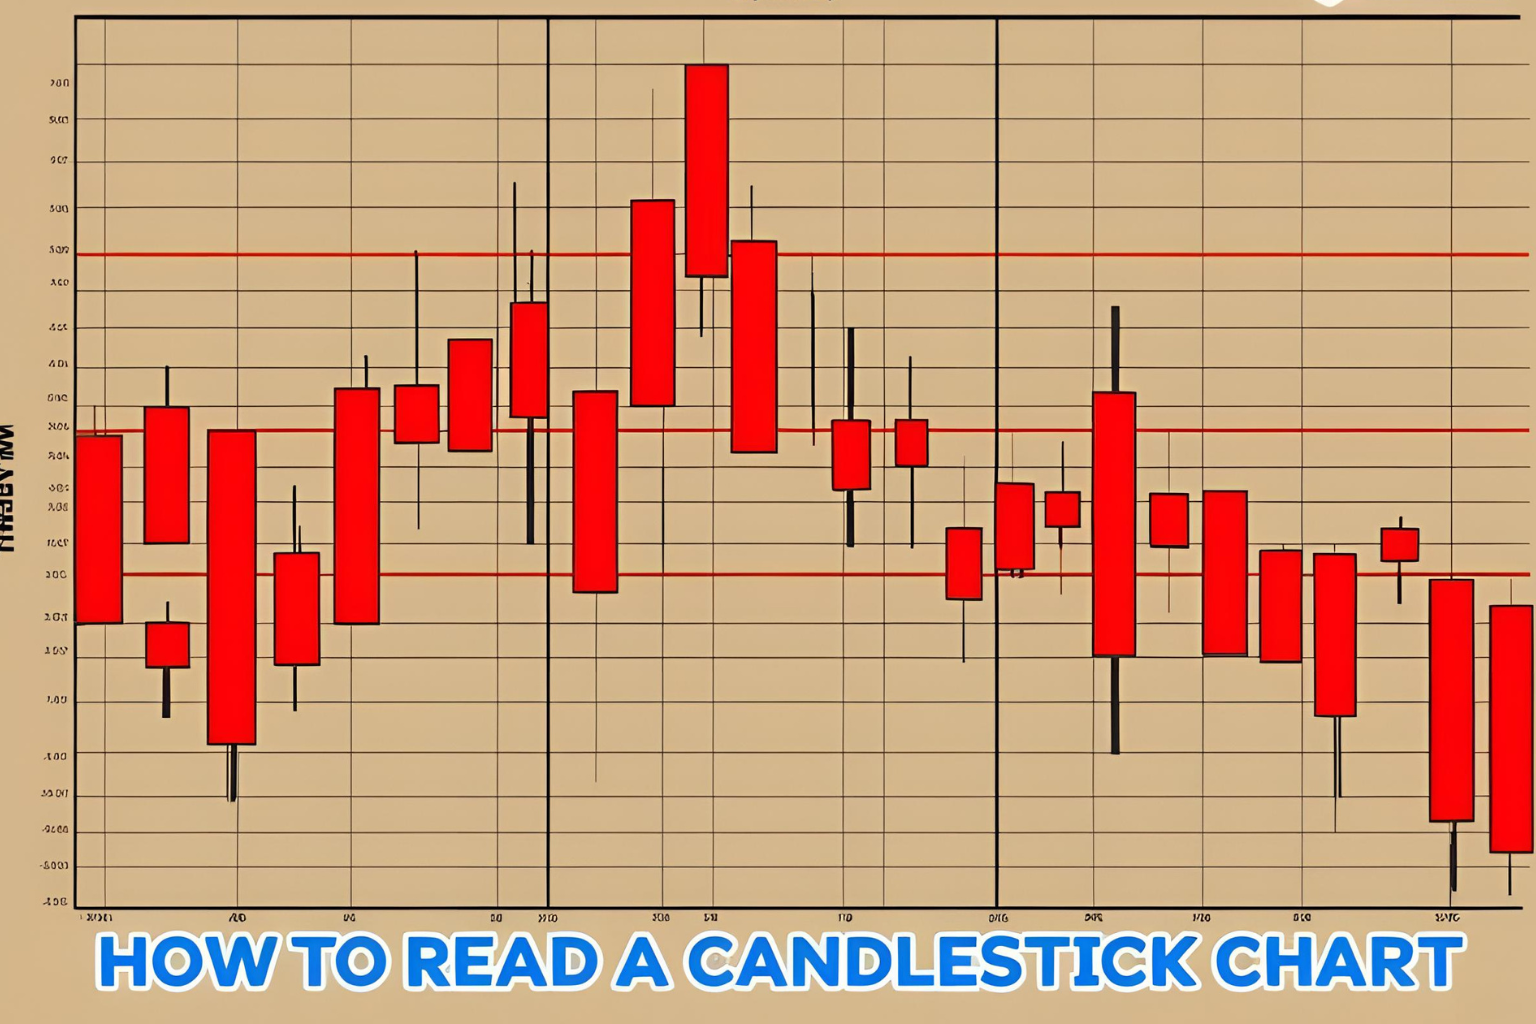
A candlestick chart is a type of price chart that shows the high, low, open, and close prices of a stock for a specific time period. Each “candle” on the chart represents this data in a visual block, helping traders understand market sentiment quickly.
Structure of a Candlestick
Each candlestick has:
- Body: The range between the opening and closing prices.
- Wick (or Shadow): The line above and below the body, showing the high and low prices.
- Color:
- Green/White (Bullish Candle): Close > Open
- Red/Black (Bearish Candle): Close < Open
Example: A green candle in Reliance’s intraday chart indicates buyers were in control during that time period.
Step-by-Step Guide to Reading Candlestick Charts
Step 1: Choose Your Timeframe
Decide if you’re analyzing for intraday (5-min, 15-min), swing (1-day), or long-term investing (weekly/monthly).
Use platforms like TradingView India or Zerodha Kite to adjust the chart’s timeframe.
Step 2: Identify Candle Types
Observe the latest candlesticks and look for:
- Long bodies (strong price movement)
- Short bodies (sideways or indecisive)
- Long wicks (volatility or rejection)
Step 3: Spot Patterns
Learn simple bullish/bearish reversal patterns:
- Bullish Engulfing
- Doji
- Hammer
- Shooting Star
These patterns work well on NIFTY, BANKNIFTY, and major NSE stocks.
Step 4: Check Volume
Combine candle analysis with volume spikes. For example, a bullish engulfing with high volume on Infosys can signal strong buying.
Step 5: Confirm with Support/Resistance
Use horizontal support/resistance lines to validate candle signals.
A bullish candle forming near support (e.g., 200 EMA) strengthens the signal.
Practical Example (Indian Stock)
Stock: TCS
Timeframe: Daily
- TCS forms a Hammer at ₹3600 support with increased volume
- This could indicate a bullish reversal
- Entry: ₹3625; Target: ₹3750; Stop Loss: ₹3580
Tips for Beginners
- Practice reading charts on NSE/BSE stocks before placing real trades.
- Use demo platforms or paper trading features.
- Combine candlestick reading with basic indicators like RSI or Moving Averages.
FAQs
1. What is the best timeframe to read candlestick charts in India?
For intraday trading, 5-min and 15-min charts work best. For positional trading, use daily or weekly charts.
2. Do candlestick patterns work on all Indian stocks?
They work better on liquid, high-volume stocks like Reliance, HDFC Bank, Infosys, etc.
3. Which is the best platform to view candlestick charts for Indian stocks?
TradingView India, Zerodha Kite, and Upstox Pro are among the best.
4. Can beginners rely only on candlestick charts for trading?
It’s a good start, but combining them with support/resistance and volume gives better accuracy.
5. Are candlestick charts suitable for long-term investors?
Yes, long-term investors can use weekly/monthly candlestick charts to time entry and exit points better.