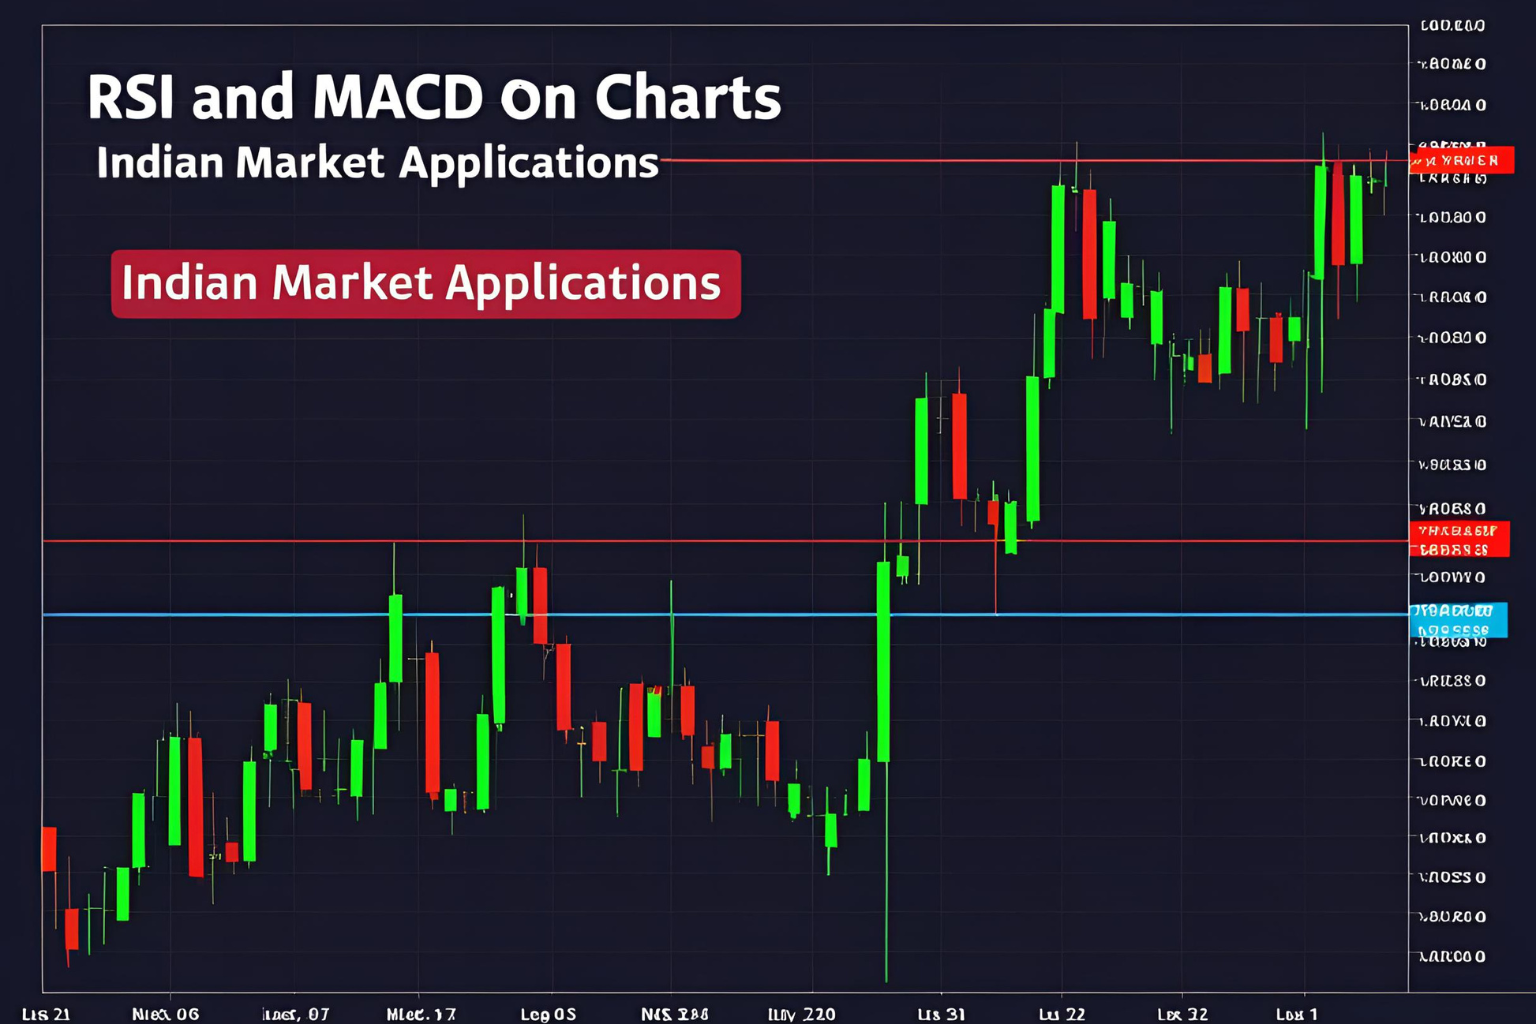
RSI and MACD on Charts: Indian Market Applications
When it comes to technical analysis in the Indian stock market, RSI (Relative Strength Index) and MACD (Moving Average Convergence Divergence) are two of the most widely used indicators. These tools help traders assess momentum, trend strength, and potential entry/exit signals in stocks, indices, and derivatives. This guide explains how RSI and MACD work and how they can be applied effectively to Indian stock charts.
What Is RSI?
The Relative Strength Index (RSI) is a momentum oscillator that measures the speed and change of price movements.
- Scale: 0 to 100
- Overbought Zone: Above 70
- Oversold Zone: Below 30
- Default Period: 14
How RSI Helps Indian Traders
- Identify reversal zones in NIFTY and BANKNIFTY
- Spot divergence between price and momentum
- Works best in ranging markets
Example: If Infosys RSI drops below 30 on the daily chart, it may signal an oversold condition.
What Is MACD?
MACD is a trend-following momentum indicator based on moving averages.
- Components:
- MACD Line = 12 EMA – 26 EMA
- Signal Line = 9 EMA of MACD
- Histogram = MACD Line – Signal Line
How MACD Helps Indian Traders
- Detects trend reversals and momentum shifts
- MACD crossover with Signal Line gives buy/sell signals
- Histogram indicates the strength of the trend
Example: A bullish crossover in the MACD line on HDFC Bank may hint at a potential uptrend.
RSI and MACD Together: Powerful Combo
When used together, RSI and MACD confirm each other’s signals.
Best Application:
- Use RSI for timing entries (overbought/oversold)
- Use MACD for trend direction
Case Study: TCS
- RSI at 35 (oversold)
- MACD crossover above Signal Line
- Result: Strong upward rally in the next 5 days
Applying RSI & MACD on Indian Platforms
| Platform | Supports RSI | Supports MACD |
|---|---|---|
| Zerodha Kite | ✅ | ✅ |
| TradingView India | ✅ | ✅ |
| Upstox Pro | ✅ | ✅ |
| Chartink | ✅ | ✅ (limited) |
FAQs
1. What is a good RSI value to buy Indian stocks?
RSI between 25 and 35 is often a good signal for potential buying opportunities in oversold zones.
2. Can MACD be used for intraday trading in India?
Yes, MACD works well on 5-min and 15-min charts for high-volume stocks like Reliance, Tata Motors, and NIFTY 50.
3. Should I use RSI and MACD together?
Yes, combining both reduces false signals and increases confirmation for entries and exits.
4. What are common mistakes with RSI and MACD?
- Acting on RSI/MACD alone without price action
- Using default settings in highly volatile stocks without adjustment
5. Are RSI and MACD available in all Indian charting tools?
Yes, most modern Indian platforms like TradingView, Zerodha Kite, and Fyers One offer these by default.


