What Are Stock Charts? A Beginner’s Guide for Indian Traders
If you’re just starting your journey in the Indian stock market, understanding stock charts is one of the most important skills you can develop. Stock charts are visual tools that help traders and investors track price movements, analyze trends, and make better decisions.
In this beginner’s guide, we’ll break down what stock charts are, how they work, and how you can start using them to analyze Indian stocks.
What Is a Stock Chart?
A stock chart is a graphical representation of a stock’s price over time. It shows the Open, High, Low, and Close (OHLC) prices and often includes volume data. Charts help visualize price action, trends, and market behavior.
Example: A daily chart of Reliance Industries displays how its price changed each day over the last month.
Why Stock Charts Matter for Indian Traders
- Identify bullish or bearish trends
- Spot support and resistance levels
- Time entry and exit points
- Analyze market volatility
- Combine with indicators for strategy building
Whether you’re trading intraday on Zerodha Kite or investing through Upstox, charts are the foundation of technical analysis.
Types of Stock Charts (Used in India)
1. Line Chart
- Simple and clean
- Plots closing prices only
- Best for long-term trend viewing
2. Bar Chart (OHLC)
- Shows open, high, low, and close
- More data, less visual clarity for beginners
3. Candlestick Chart
- Most popular format among Indian traders
- Easy to interpret bullish/bearish behavior
- Used for patterns like Doji, Hammer, Engulfing
Basic Chart Elements
| Component | What It Shows |
|---|---|
| Time Axis | Horizontal, showing days/hours/etc. |
| Price Axis | Vertical, showing stock prices |
| Candles/Bars | Visuals of price movement |
| Volume | Number of shares traded in that time |
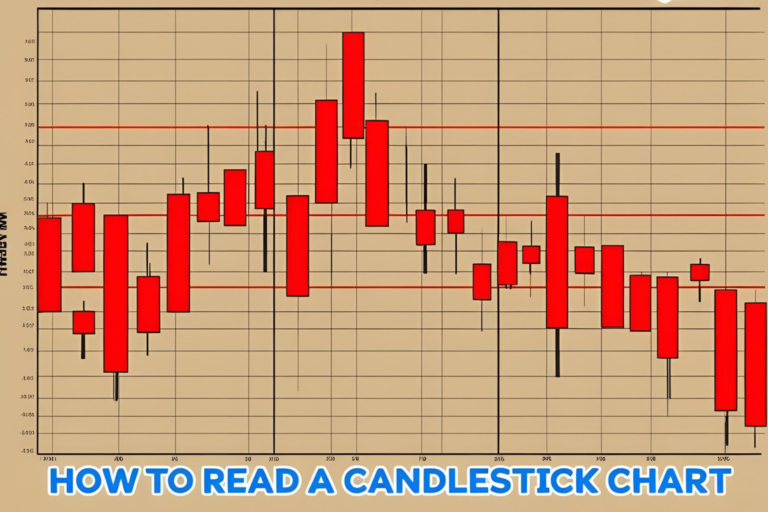
How to Read a Simple Candlestick Chart
| Candle Type | Interpretation |
|---|---|
| Green Candle | Close > Open = Bullish (Price rose) |
| Red Candle | Close < Open = Bearish (Price fell) |
| Long Wicks | Volatility or price rejection |
Platforms to View Indian Stock Charts
| Platform | Charting Type | Access |
|---|---|---|
| TradingView India | Advanced | Free & Paid Plans |
| Zerodha Kite | In-Built | Requires Demat |
| Upstox Pro | In-Built | Free Account |
| Chartink | Basic/EOD | Free |
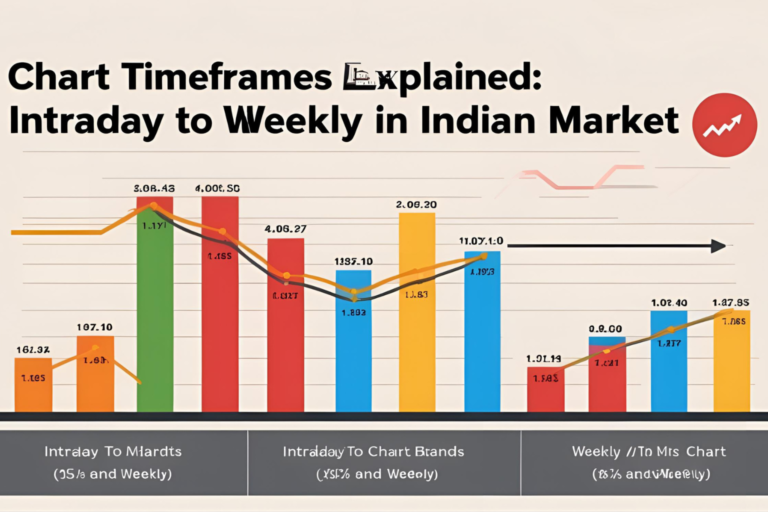
When Should You Use Stock Charts?
- Intraday Trading: Use 5-min or 15-min charts for entries
- Swing Trading: Use daily charts to hold for a few days
- Investing: Weekly/monthly charts help spot long-term trends
FAQs
1. Are stock charts necessary for beginners in India?
Yes. Even basic understanding helps in avoiding poor entry/exit points and builds trading discipline.
2. Can I use stock charts for free?
Yes. Platforms like TradingView India and Chartink offer free charting tools.
3. Which chart type is best for Indian stock analysis?
Candlestick charts are most informative and widely used by traders at all levels.
4. Do I need a Demat account to view charts?
Not always. Public charting sites like TradingView and Chartink don’t require Demat login.
5. Are Indian stock charts different from global ones?
The chart structure is the same globally; what differs is the stock exchange and data source (NSE/BSE in India).